

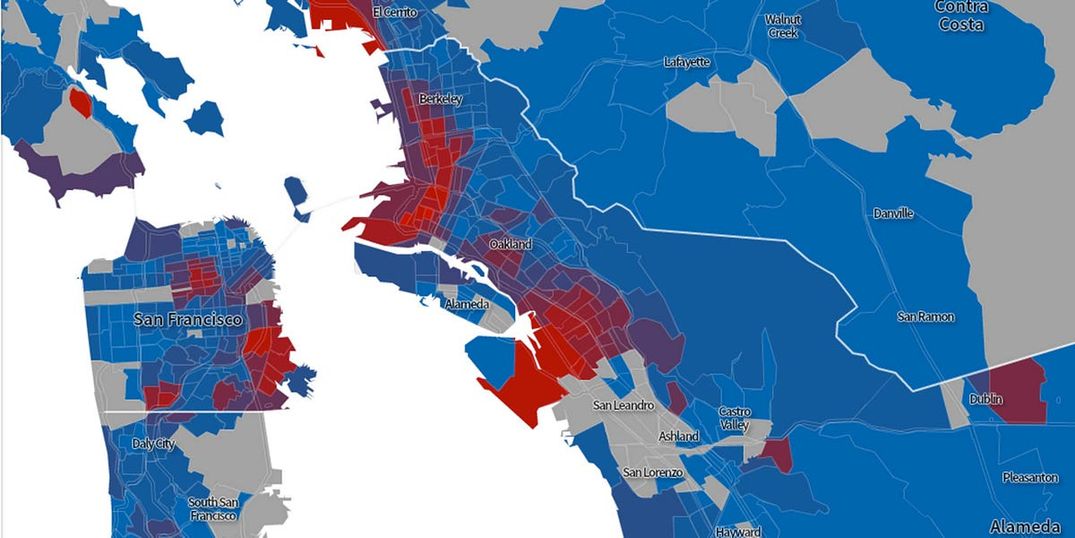
Conversations about the changing demographics in San Francisco and the Bay Area are never ending. One new map by the Anti-Eviction Mapping Project shows the loss of the African-American population in San Francisco and Alameda Counties during a span of 43 years. Using Census and American Community Survey data, the map shows the African-American population change in six different stretches of time, beginning in 1970 and ending in 2013.
According to the Anti-Eviction Mapping Project, the African-American population has decreased from 15% to 12% in Alameda County and from 13% to 6% in San Francisco. The map also includes an infographic showing that the black population has decreased while the overall population of San Francisco has increased and continues to do so.
The map is a response to two earlier projects — one visualizing the stories of those killed by the San Francisco Police Department, another with the Oakland Police Department. While people continue to protest across the country over police brutality, the Anti-Eviction Mapping Project felt this new map falls perfectly into the discussion.
“There are a lot of conversations nationally about police brutality and one locally about evictions,” said Erin McElroy of the Anti-Eviction Mapping Project. “We wanted to create this map to show that the African-American community is under attack in more than one way.”
In San Francisco, neighborhoods highly populated by African-Americans once included the Fillmore District, Western Addition, and the Bayview District. These areas were between 40% and over 95% black in 1970. If you fast-forward to the year 2000, the change is astounding. In the Western Addition, a population that was 80% black changed to only being 30% black. If you move forward in dates and look at the 2013 estimates, that number is now only at seven percent for the larger area of the neighborhood, which include the Western Addition and the Richmond in its count.
Over in Alameda County, neighborhoods heavily populated by African-Americans in the 1970s included West Oakland and South Berkeley, with data showing that these areas were once 83% and 78% black, respectively. In 2010, some areas of West Oakland drop to 51% black whereas the decrease is more significant in South Berkeley, from 85% to 34% black. The data grows bleaker in 2013, showing that the same space in Berkeley now has only a 7.8% black population and only that demographic comprises only 26% of West Oakland.
Top photo courtesy of the Anti-Eviction Mapping Project.
Got a tip for The Bold Italic? Email tips@thebolditalic.com.
The Bold Italic is a not-for-profit media organization, and we publish first-person perspectives about San Francisco and the Bay Area. We operate under a fiscal sponsorship of a 501(c)(3).
You can become a paid subscriber. Or donate. Or learn more about us.